

Most mid-market companies have plenty of technology ideas. Sales wants a better CRM workflow. Operations wants fewer manual handoffs. Finance wants faster close and cleaner reporting. Security wants better control. The CEO hears AI pitches every week. The real question is simple: what gets funded first?
I have spent more than 20 years working on that problem. I have done it in global roles, and as CTO at Shoppers Drug Mart and Loblaw. I founded The Narrative Group because mid-market companies need the same discipline large enterprises use, but in a form that fits their reality.
When priorities are clear, technology improves productivity, reduces waste, and supports growth. When priorities are fuzzy, the portfolio gets pushed around by urgency, politics, vendor hype, and fear.
Gartner’s 2026 CIO Agenda found that 94% of CIOs expect major changes to their plans and outcomes within 24 months, while only 48% of digital initiatives meet or exceed business targets. McKinsey’s digital transformation survey found that organizations capture only 31% of expected revenue benefits and 25% of expected cost benefits on average. That gap is what bad prioritization looks like.
Why the Loudest Voice Usually Wins
In a lot of mid-market businesses, nobody owns the full technology portfolio at the executive level. There may be a strong finance leader. There may be a capable operations leader. There may be a tactical IT manager working very hard every day. But hard work is not the same thing as portfolio discipline.
So what happens? The broken thing gets funded. The board question gets funded. The strongest personality gets funded. The vendor with the slickest presentation gets funded. People start talking in ambiguity. Everybody nods. When the rubber hits the road, the business rules are fuzzy and the value is hard to prove.
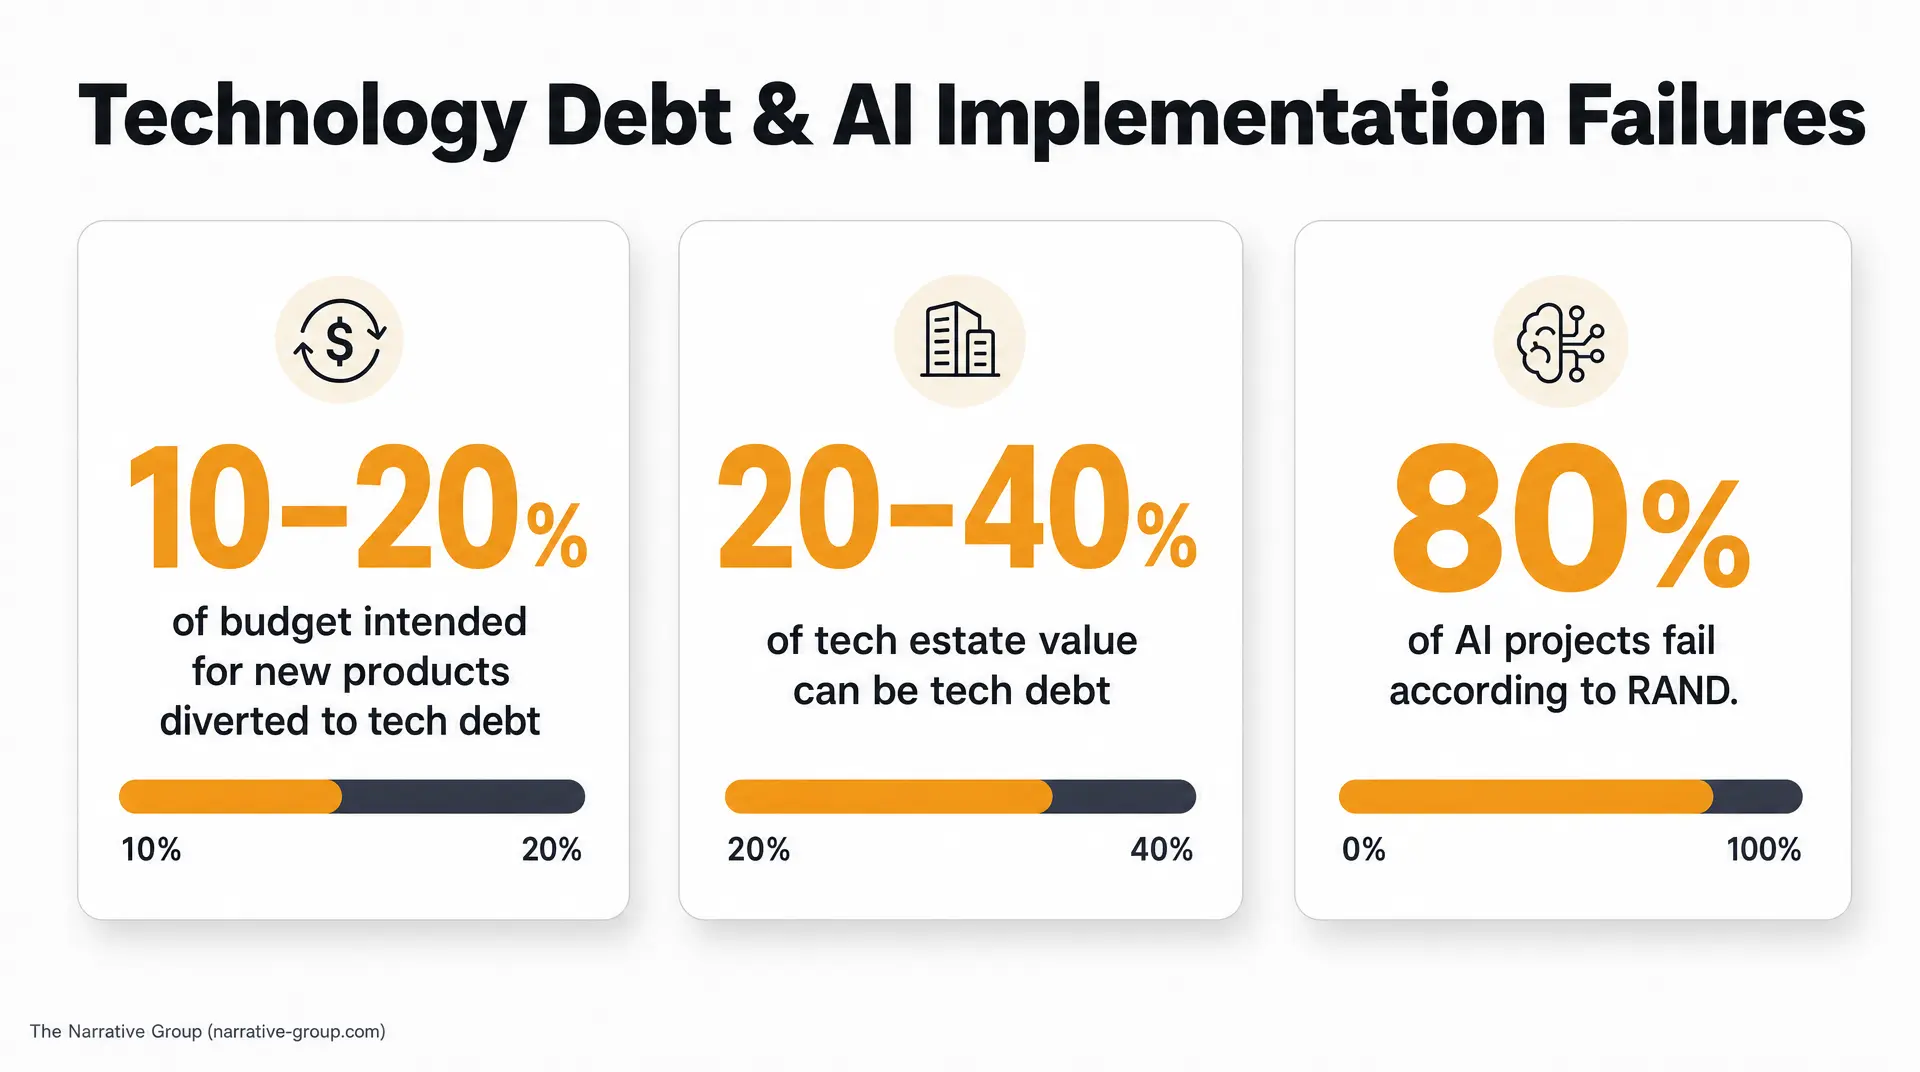
The cost shows up fast. McKinsey found that 10% to 20% of technology budget intended for new products gets diverted to tech debt, and that tech debt can equal 20% to 40% of the value of the technology estate before depreciation. The same research found that 60% of CIOs said their tech debt had risen over the previous three years. Flexera’s 2026 State of the Cloud Report found that 85% of organizations say managing cloud spend is a top challenge, and wasted cloud spend has risen to 29%.
I have also seen companies chase small savings that create bigger costs later. A business trims license spend and feels good for a quarter. The work does not disappear. The cost shifts into manual effort, workarounds, and delay. I have seen an old tool like Mail Manager kept in place to avoid Microsoft license fees, and years later even a Windows 11 upgrade gets harder because that shortcut is still sitting in the middle of the environment.
This is why I tell leaders to stay current and mainstream. Use vanilla software for common processes. The more a company insists that every common workflow is special, the more cost it creates for itself. That cost sticks around for years.
Start with Financials First
My first question is always the same. How do you actually make money?
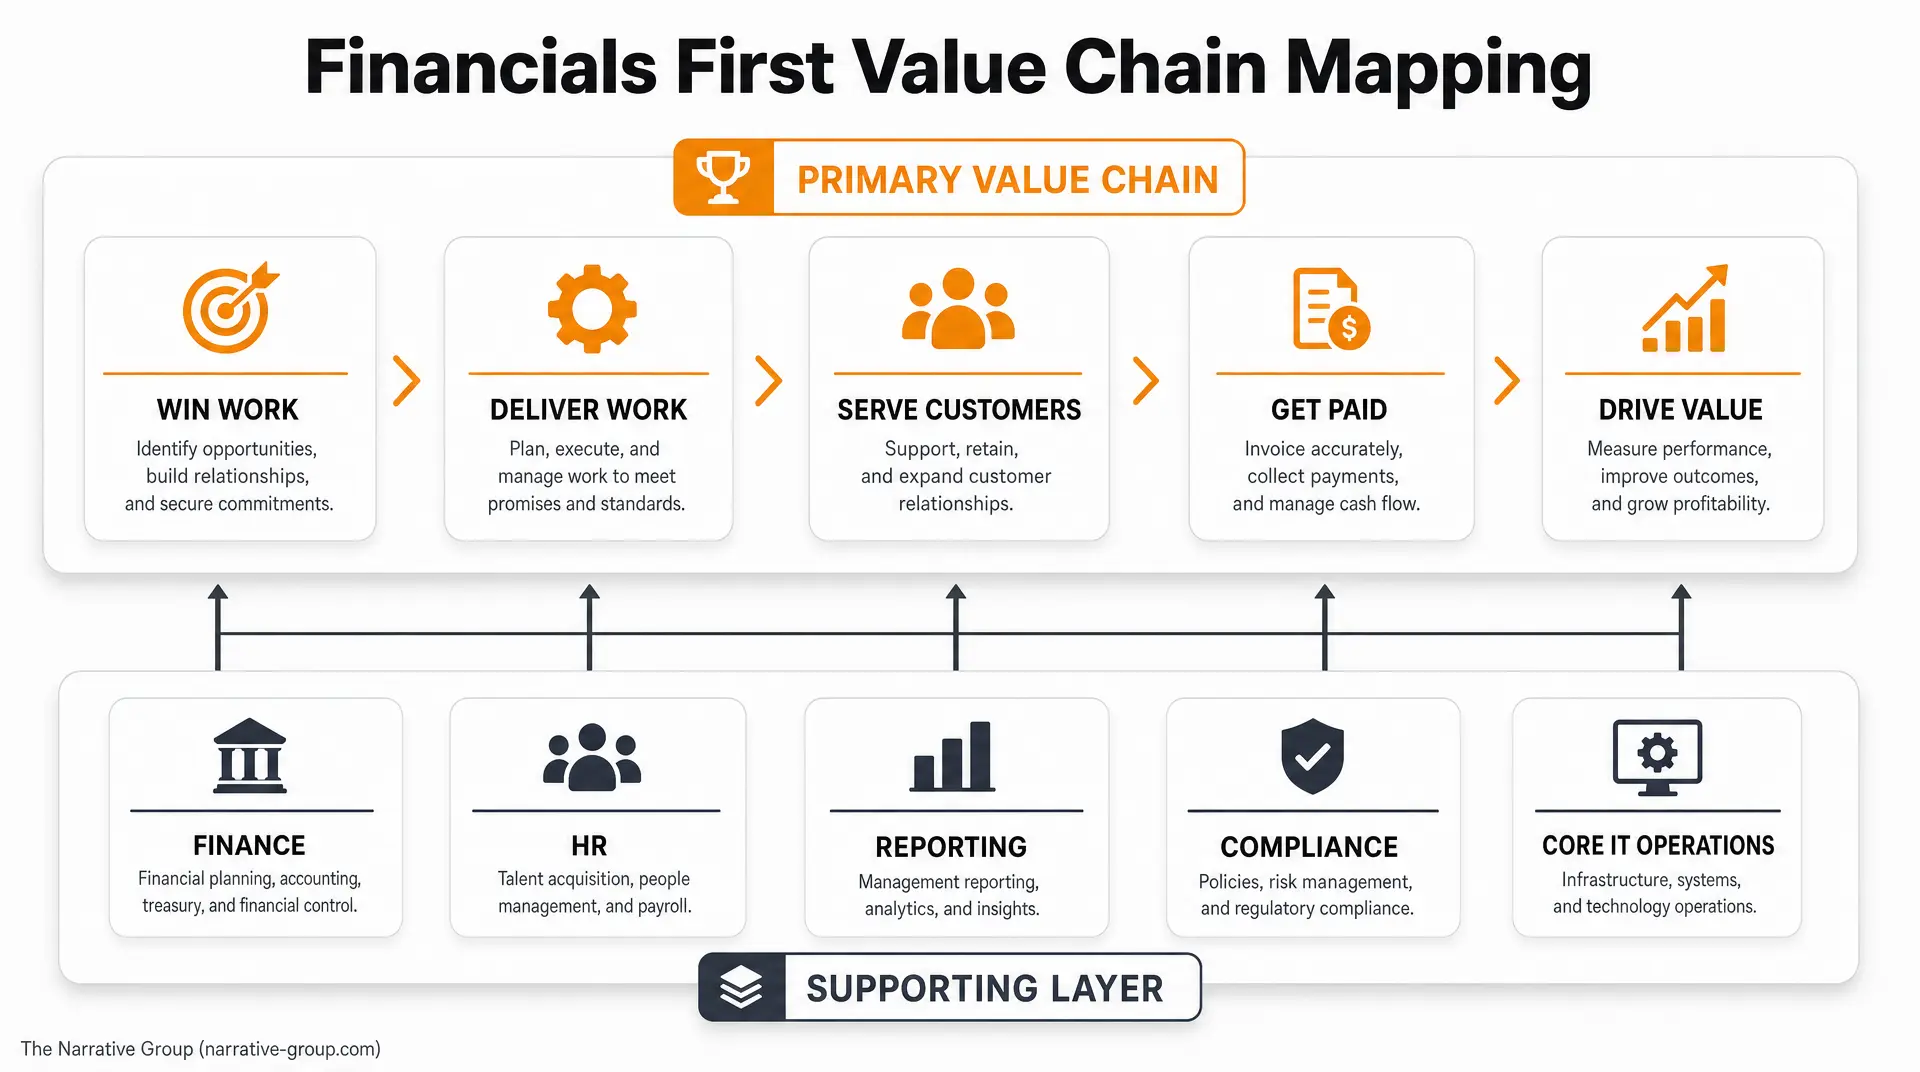
That question cuts through a lot of noise. It forces the discussion back to the business model. Once I understand how the company creates value, I can start mapping the value chain. I can see where revenue is created, where margin gets squeezed, where handoffs slow down, and where the technical architecture is in conflict with the value chain.
At The Narrative Group, we call this Financials First. We look at how the company spends money on IT, how it deploys capital, and how the current environment affects the P&L. I want to see total IT spend against revenue and expense. I want to understand the mix of IT labor and non-labor spend. I want to see service levels, uptime, and where downtime is killing productivity.
Then I split the business into two parts. The first is the primary value chain. That is how the business wins work, delivers work, serves customers, and gets paid. The second is the supporting layer. Finance, HR, reporting, compliance, and core IT operations sit there. Those functions matter a great deal, but they support the value chain rather than define it.
From there, every major process gets a hard look. Is it a competitive advantage? Is it economic parity? Is it a commodity? Specifically and ruthlessly figure out where exactly are you different. Most companies discover that far more of their operations are commodities than they thought. That matters, because you should invest very differently in a true differentiator than you do in a commodity process.
The Four Dimensions That Matter
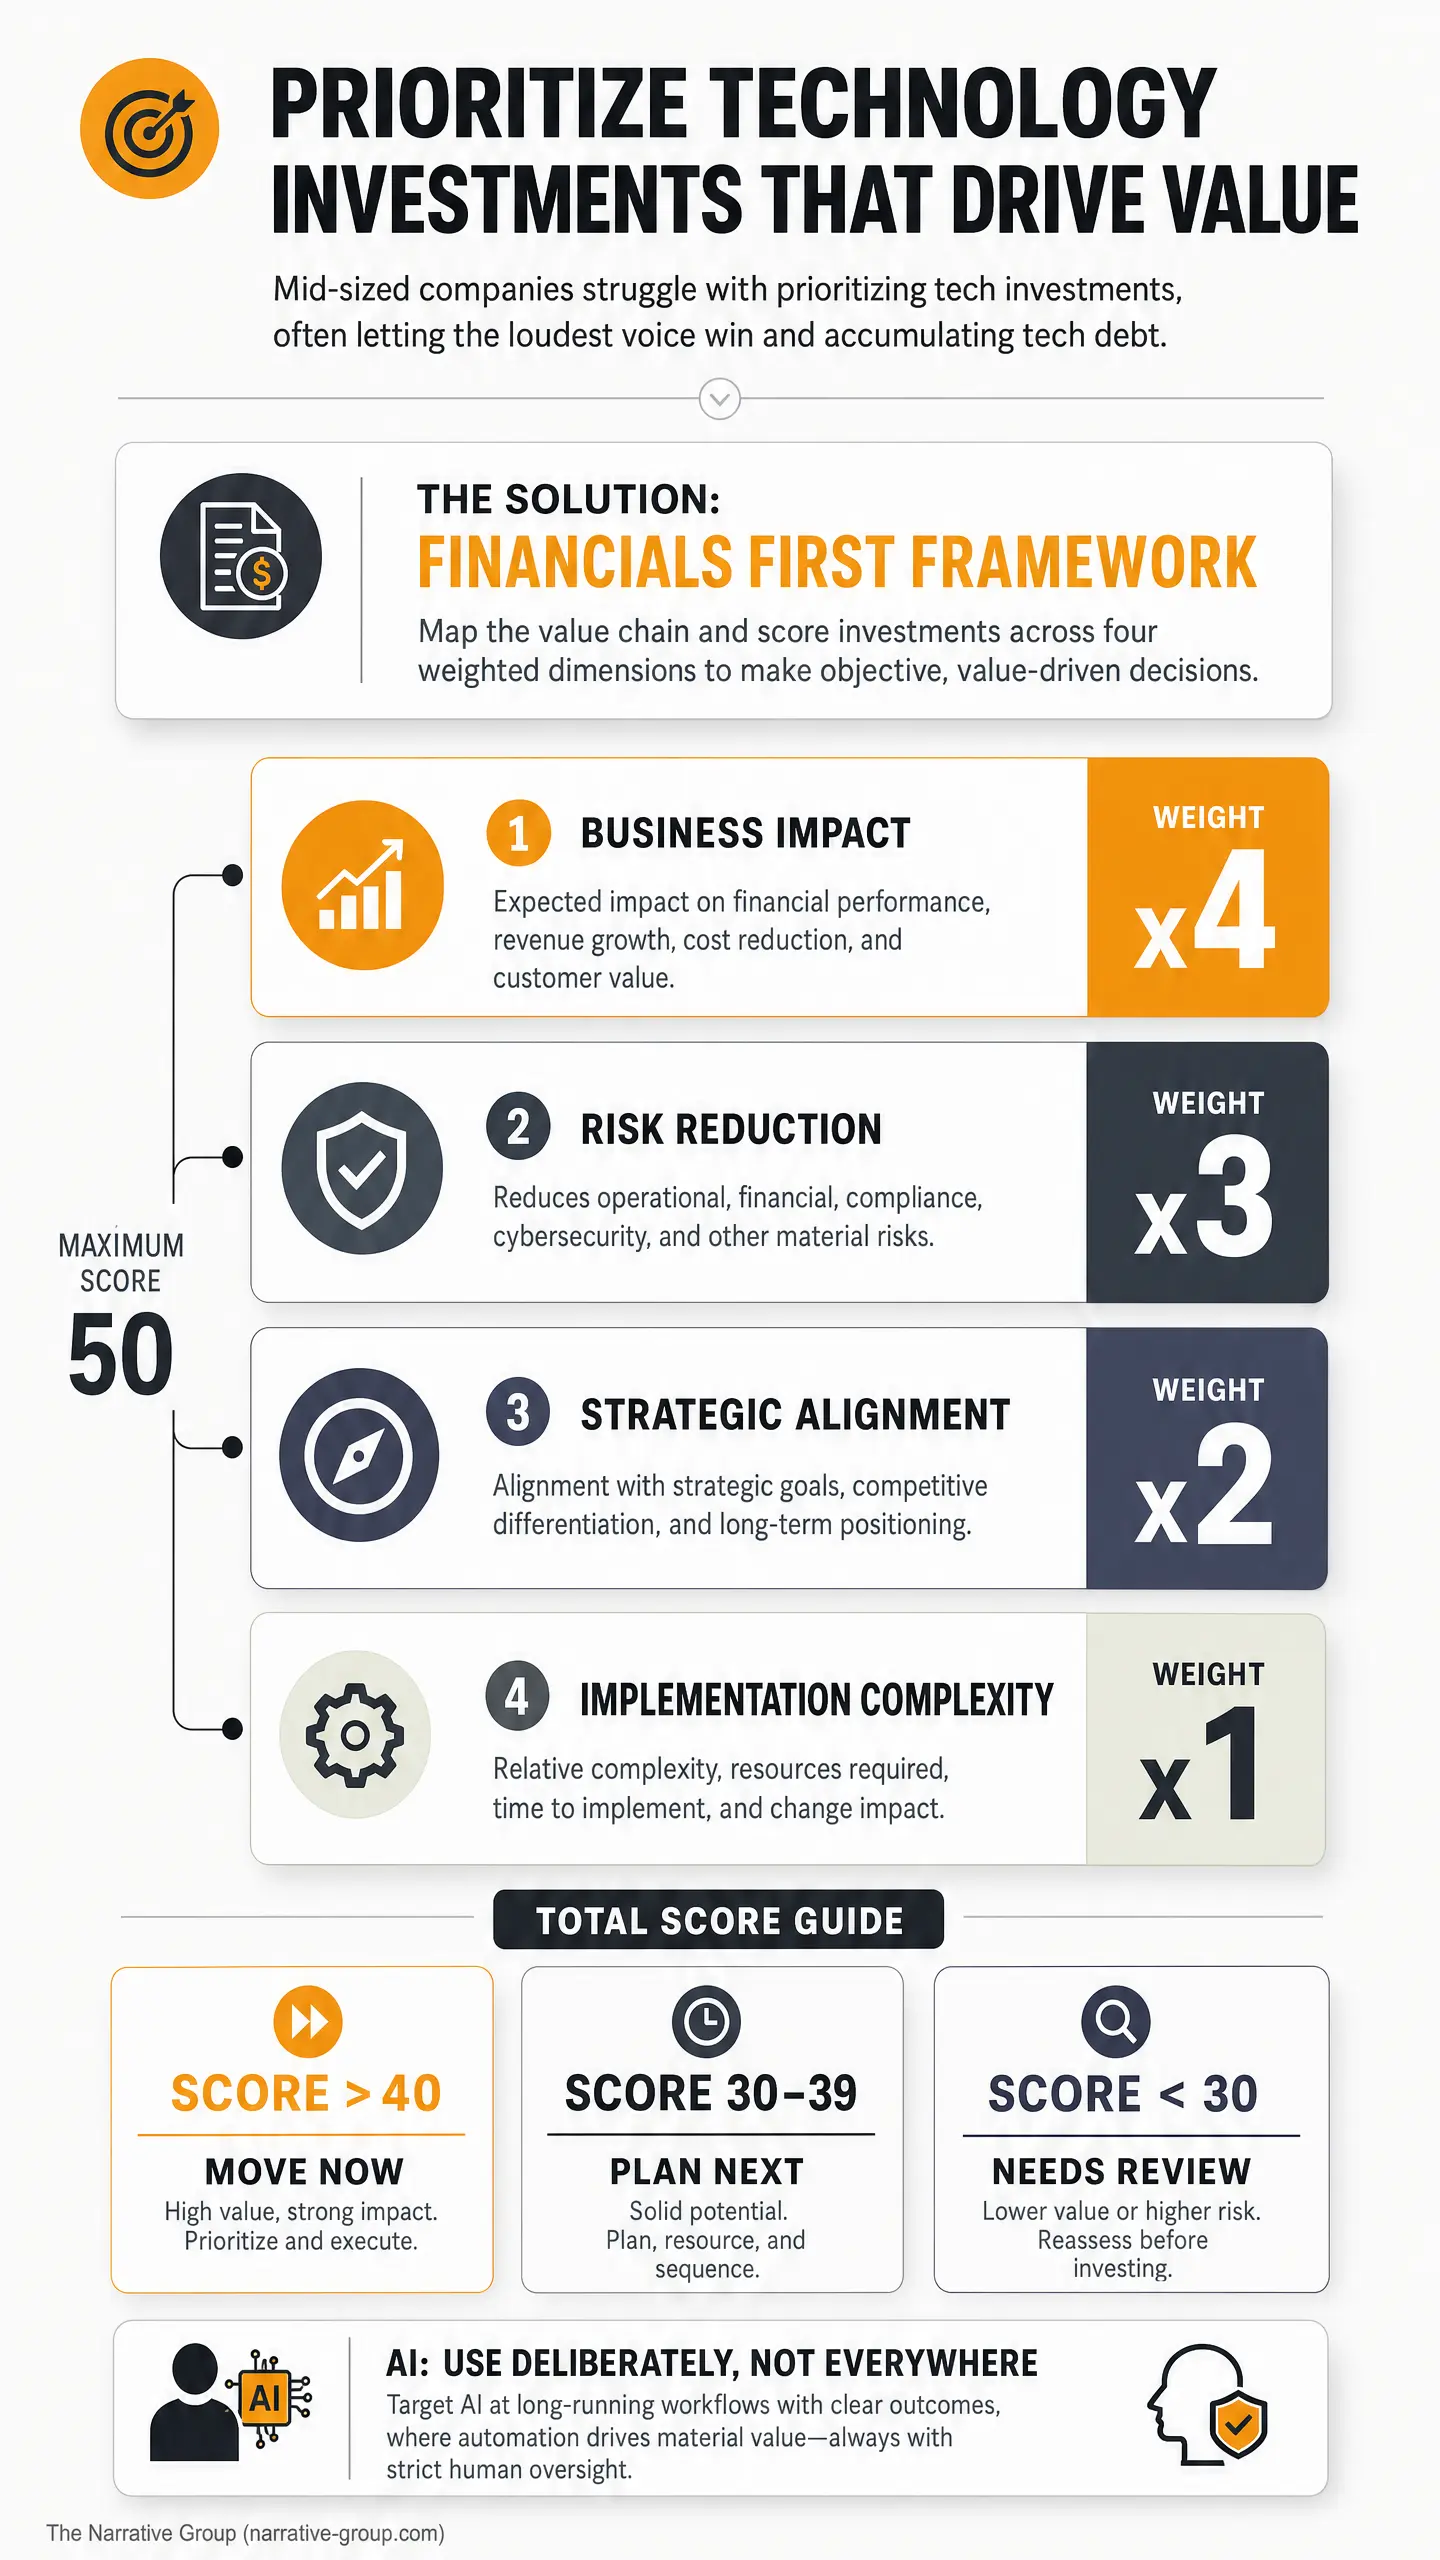
Once the value chain is clear, prioritization gets much easier. I score technology investments across four dimensions. I look at business impact first. Then I look at risk reduction. Then I assess implementation complexity. Finally, I test strategic alignment. If an investment is weak across those four areas, it should not be near the top of your list.
1. Business Impact
Business impact comes first because every company is here to make money. So ask the blunt question. What changes in the P&L if we fund this?
Sometimes the answer is revenue. Sometimes it is margin. Sometimes it is cycle time, capacity, or customer retention. Sometimes it is a lower rate of hiring because your people can do more work with the same effort. That often surprises executives, but it is real value. Productivity gains change how fast a company has to add labor as it grows.
You have to measure this in business terms. Track the time required to execute the process today. Then measure it again after the change. Use the metrics the business already trusts. Innovation is making the operation of a business model elegant. If the investment does not make the model more elegant, the score should stay low.
I learned this very clearly in retail. With self-checkout, the labor model only works when the user experience is simple and the underlying data is right. If pricing data is off or the screen is clumsy, interventions go up and labor goes back into the store. Good ideas still have to prove themselves in live operations.
A score of one means the benefit is vague. A three means the gain is useful, but partial. A five means you can tie the investment to a real metric and a real financial result.
2. Risk Reduction Value

A lot of executives underweight risk reduction because they do not see a new revenue line beside it. That is a mistake. A serious outage or a serious breach is a business event. It hits service, reputation, cash, and management attention all at once.
Uptime Institute’s 2025 Annual Outage Analysis found that 54% of respondents said their most recent serious outage cost more than $100,000, and one in five said it cost more than $1 million. IBM’s 2025 Cost of a Data Breach Report puts the global average breach cost at $4.44 million and the average U.S. breach cost at $10.22 million. Verizon’s 2026 DBIR found that 31% of breaches start with vulnerability exploitation, and third-party supply-chain breaches now account for 48% of total breaches after a 60% jump.
So quantify your exposure. How much downtime did you have last year? What did it cost? Which systems create compliance risk? Which vendors create concentration risk? Which weak controls could become a board problem very quickly?
This is why I tell leaders to find the boring foundational functions first. If your infrastructure, identity controls, patching, backups, or network core are weak, every shiny project on top of them carries more risk.
We saw that in a six-office organization we worked with. People moved from one office to another and could not connect properly. Meeting rooms barely worked. Old servers and network gear kept getting in the way. We stabilized the environment office by office, replaced the core network and outdated infrastructure, and put devices on lifecycle management. The business got a reliable foundation, and leadership got room to focus on bigger issues.
A one here means the issue is irritating but tolerable. A three means the exposure is meaningful and recurring. A five means the company is carrying material operational, cyber, compliance, or vendor risk.
3. Implementation Complexity

This is where a good-looking spreadsheet can fool you.
Implementation complexity is about much more than time and budget. I want to know whether the business rules are clear. I want to know whether the data is usable. I want to know how many systems and vendors are involved, how much change the front line can absorb, and whether the executive team is actually aligned.
A lot of rollouts fail for one simple reason. The process was underdefined. The business rules were never made explicit. Then a team builds a system around guesswork. Bad things happen very quickly when that goes into production. You can’t just codify broken business processes.
That is why I insist on mapping data flows. Who is talking to who? How often? Where is data being rekeyed? Where do approvals stall? Draw it out. The picture tells a thousand words. Once you see the flow, you start to see where the complexity really is.
The scoring here runs in reverse. A five means the path is reasonably clear and the dependencies are manageable. A one means the process is messy, the data is weak, and the change path is likely to disrupt day-to-day operations.
4. Strategic Alignment
The final dimension is strategic alignment. Does the investment clearly support where the company is going? Or is it sitting off to the side because somebody asked for it?
I like to organize the portfolio into three to five themes. Growth is usually one. Productivity is usually one. Risk and compliance belong there. Customer experience often belongs there. Foundational stability usually does too. Once those themes are clear, every project has to support one of them.
This is also where I remind leaders that IT is effectively two departments. One side is the foundational operational stack. End-user support, network, core infrastructure, baseline security, and commodity cloud operations live there. The other side is business enablement. Workflow improvement, analytics, automation, and the systems that amplify how the company creates value live there.
Keep those two worlds separate in your mind. Commodity work should be managed as commodity work. Strategic work deserves your strongest internal focus. What makes a company unique is the people, not the technology. The right technology amplifies their skills, their creativity, their superpower.
A one on strategic alignment means the project is loosely connected to strategy. A three means it supports one theme, but the case is not tight. A five means it directly supports a core business objective and strengthens the value chain.
The Scoring Model I Recommend
I keep the model simple because executives need to use it, not admire it.
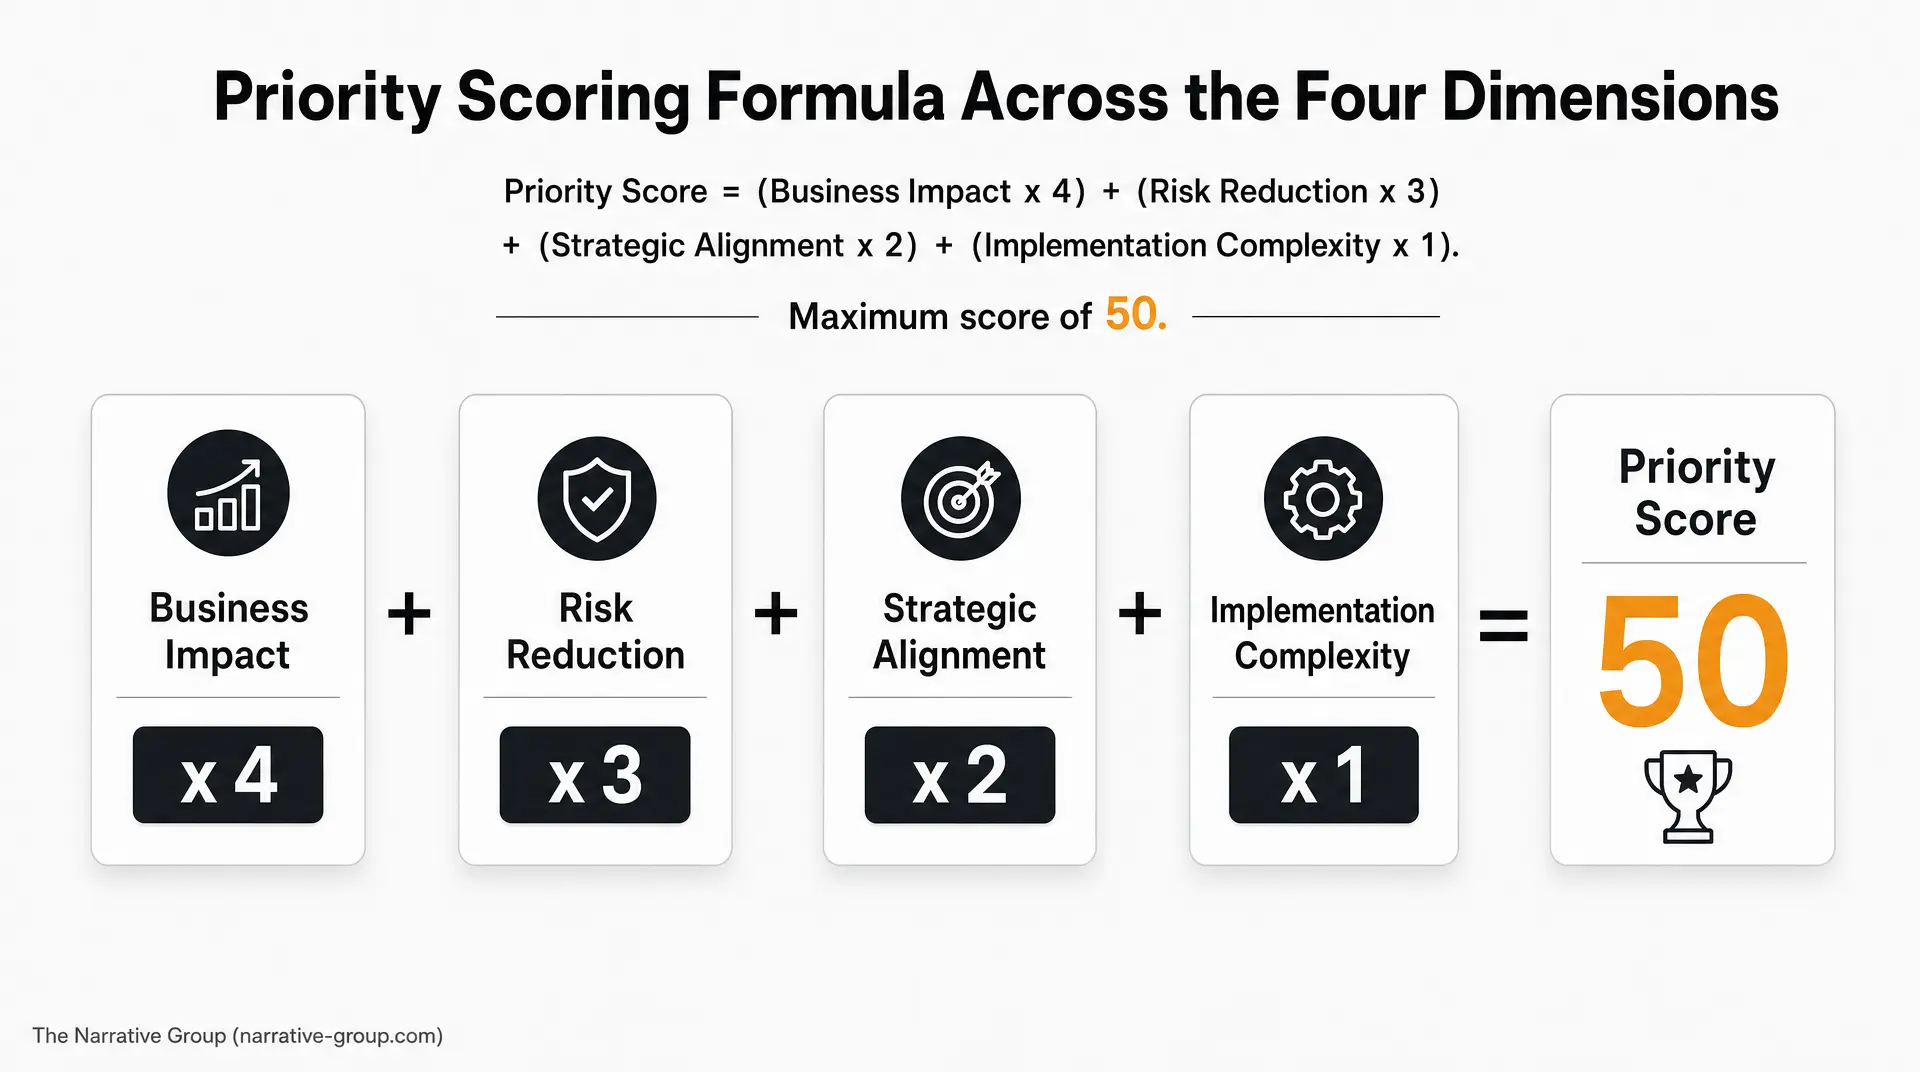
Score each investment from one to five on each of the four dimensions. Then weight the score. I weight business impact most heavily because it is closest to value creation. I weight risk reduction next because unmanaged risk destroys value quickly. Strategic alignment comes after that. Complexity gets the lightest weight because it should shape sequencing more than importance.
Priority Score = (Business Impact x 4) + (Risk Reduction x 3) + (Strategic Alignment x 2) + (Implementation Complexity x 1)
That gives you a maximum score of 50.
A score above 40 usually belongs in the “move now” category. Scores in the 30s usually mean “plan next and start preparing.” Projects in the 20s need a harder look. Sometimes they belong in a pilot. Sometimes they need process work first. Sometimes they should be deferred. Very low scores tell you something useful too. They tell you the request may be noise.
There is one caveat. Mandatory regulatory or legal work gets done. Just label it honestly. Call it a compliance or risk investment. That keeps the portfolio clean and gives the board a clearer view of what is driving spend.
A Quick Word on AI
AI is the buzzword making everybody hopeful right now. Fair enough. There is real opportunity there. There is also a lot of noise.
Gartner forecasts worldwide AI spending will reach $2.59 trillion in 2026, up 47% year over year. McKinsey’s 2025 State of AI found that 88% of organizations use AI in at least one business function, but only 39% report any EBIT impact and only about 6% qualify as high performers. More than 80% of AI projects fail, according to RAND.
My view is simple. Use AI where it can improve long-running workflows, strengthen data quality, and help people make decisions faster. Keep human oversight in place. Document the process first. When you are trying to get AI to make up what the business process is, you lose control.
When AI is aimed at a real bottleneck, the value can be strong. We did that in an e-commerce environment where product setup was dragging through a five-week cycle. One person could spend up to three weeks setting up the products. With AI and workflow automation, that work dropped to four hours. That is a real gain. It improves productivity, lowers the cost to operate, and frees people to work on more valuable activity.
There is good outside evidence too. NBER research found that access to a generative AI assistant increased customer-support productivity by 14% on average, with a 34% improvement for novice and low-skilled workers. So yes, score AI opportunities. Just score them honestly.
How to Run This Without Slowing the Business Down

Start by putting every active and proposed technology investment on one list. One list matters because fragmentation is the enemy. If finance has one view, operations has another, and IT has a third, you are already in trouble. Every item should have a short business description, a baseline metric, a named executive owner, and a clear statement of the expected result.
Then score the portfolio together. The CFO should be in the room. The COO should be in the room. The business sponsor should be in the room. The technology lead should be in the room. Your executives have skin in the game, so they need to own the ranking. My job, when I do this with leadership teams, is to give them enough information to make the decision and then help them own it.
Do one more thing. Get out of the meeting room. Show me the day in the life. Walk the process with the people doing the work. Listen to their frustrations. They will show you where the technology is letting them down. They will also show you where the process is vague, undocumented, or overloaded with exceptions.
Review the portfolio every quarter. Conditions change. Risks change. Growth plans change. A good framework lets you adjust without turning every quarter into chaos. It also gives you a board-ready way to explain why one project moved up and another moved down.
Final Thought

Technology investment prioritization is an executive discipline. It starts with one question: how do you actually make money? From there, you follow the money, map the value chain, score the portfolio, and invest where the business gets real leverage.
That is how you turn IT into a growth engine. That is how you reduce waste without starving the business. That is how you make better decisions before the budget is gone.
If you want a practical way to start the conversation with your leadership team, take 5 minutes to fill out the IT Investment Prioritization Scorecard. This scorecard assesses your organization across five dimensions of technology investment maturity – and shows you exactly where to focus.
If you want help applying it to your business, we can do that through a Financials First assessment at The Narrative Group.
Need Help Aligning IT Spend with Business Performance?
IT budget planning should not be a spreadsheet exercise.
For mid-market companies, the IT budget should show what the business is protecting, what it is improving, and where it is investing for growth.
Narrative’s Financials First assessment helps leadership teams connect technology spend to the value chain, risk profile, productivity opportunities, and growth priorities of the business.
Use the IT Investment Prioritization Scorecard to evaluate your next round of technology investments, or explore Financials First if your leadership team needs a clearer view of what to fund, what to fix, and what to stop.
Technology Investment Strategy (This Series)
- IT Maturity Models Explained for Mid-Market Executives
- Technology Investment Prioritization: A Framework for Mid-Sized Companies
- IT Budget Planning for Mid-Sized Companies
- How to Build a Technology Business Case Your CFO Will Actually Approve
- CapEx vs OpEx in IT Strategy
- When to Replace vs Optimize Your Business Systems
- The Hidden Cost of Reactive IT in Mid-Sized Companies
Frequently Asked Questions
How do we balance funding new features against paying down technical debt?
You fund tech debt reduction because ignoring it destroys capital. McKinsey found 60% of CIOs saw tech debt rise recently. If your foundational architecture is crumbling, new features will break faster. Treat tech debt resolution as a high-scoring ‘Risk Reduction’ initiative to protect existing revenue streams.
Should third-party vendor risk impact a project’s priority score?
Absolutely. A shiny new workflow means nothing if the vendor exposes your data. According to the Verizon 2026 DBIR, third-party supply-chain breaches now account for 48% of all breaches. Always score vendor security posture aggressively under the ‘Risk Reduction’ dimension before signing the check.
How should our framework address escalating cloud infrastructure costs?
Treat cloud optimization as a mandatory productivity initiative. Flexera reports wasted cloud spend has risen to 29%. You cannot scale efficiently with a bloated infrastructure bill. Prioritize projects that clean up cloud architecture – they offer immediate, measurable margin improvements for the P&L.
How do we stop business units from deploying rogue AI tools outside the framework?
By enforcing a strict ‘one list’ policy linked to funding. Flexera notes 53% of leaders cite security as their top AI challenge. Rogue AI creates massive compliance exposure. If it isn’t scored for business impact and risk, finance simply shouldn’t pay the invoice.
How do we hold executives accountable for the ROI promised during prioritization?
You track the baseline metric established during scoring. McKinsey found organizations capture only 31% of expected revenue benefits. Fix this by demanding quarterly post-implementation reviews. If a leader consistently pitches projects that fail to move the P&L, their future requests get a lower credibility weighting.